
Google Analytics for Large Enterprises Part 3: User Management
Google Analytics used to define users as administrators and users; now, however, they recognise all users as users, but with three possible types of...

If you're new to HubSpot, we guide you on where to start, how to do it right, and train you to make the most of the platform.
Review your HubSpot portal to uncover issues, spot growth opportunities, and ensure you're maximising its potential.
Unlock business growth with automation and attribution. Implement best practices and execute marketing campaigns.
4 min read
This is Part 2 of our Google Analytics for Enterprises series. You can read our Google Analytics Part 1: Overview here.
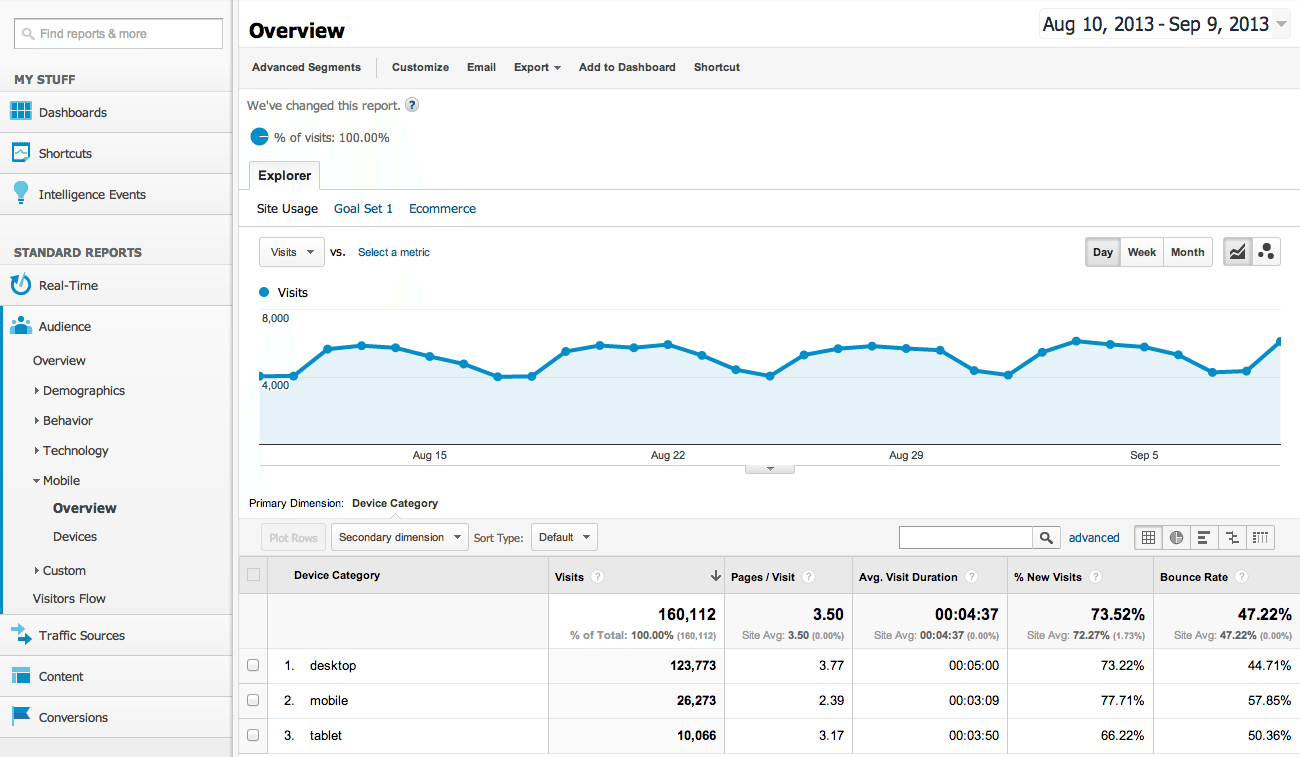
Google Analytics has a wide range of options for gathering and analysing data. Of course, what most companies want is understandable reports, which (help them to) answer key business questions. Fortunately, Google is well aware of this and has an excellent set of reporting tools.
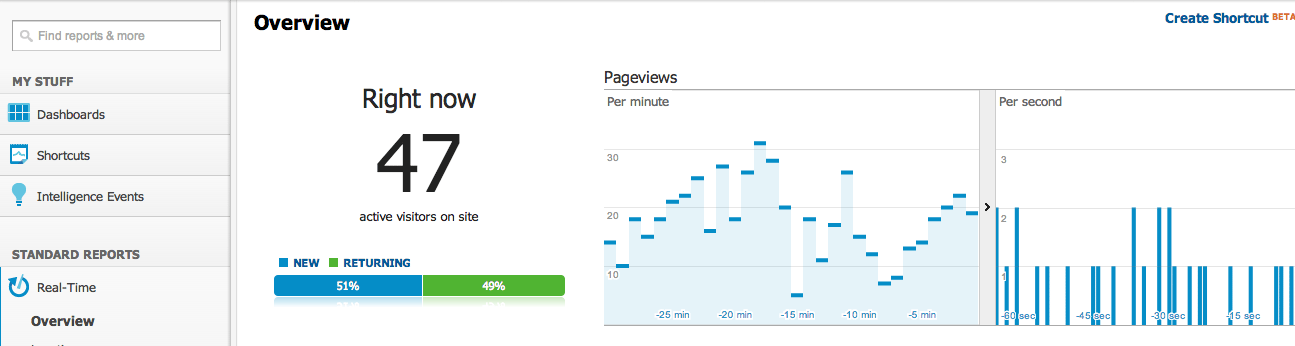
Real-Time Reporting is for tracking what visitors to your site are doing at any point in time. The window of measurement is within every 5 minutes, rather than within every 30, as is the case with other reporting applications.
The key use for real-time reporting is for measuring the impact of changes, whether it's fresh content, a style update or a social media campaign. Google Analytics can break down the visitor information by referral source and geographical location, to assist in targeted marketing.
This information is crucial to any website and Google Analytics allows it to be integrated with other information for more meaningful data. For example, it can be integrated with the ecommerce statistics to see which visitor group is more valuable in terms of purchases, or with location and engagement reports to see where, geographically, your visitors are coming from and what they are doing on your site.
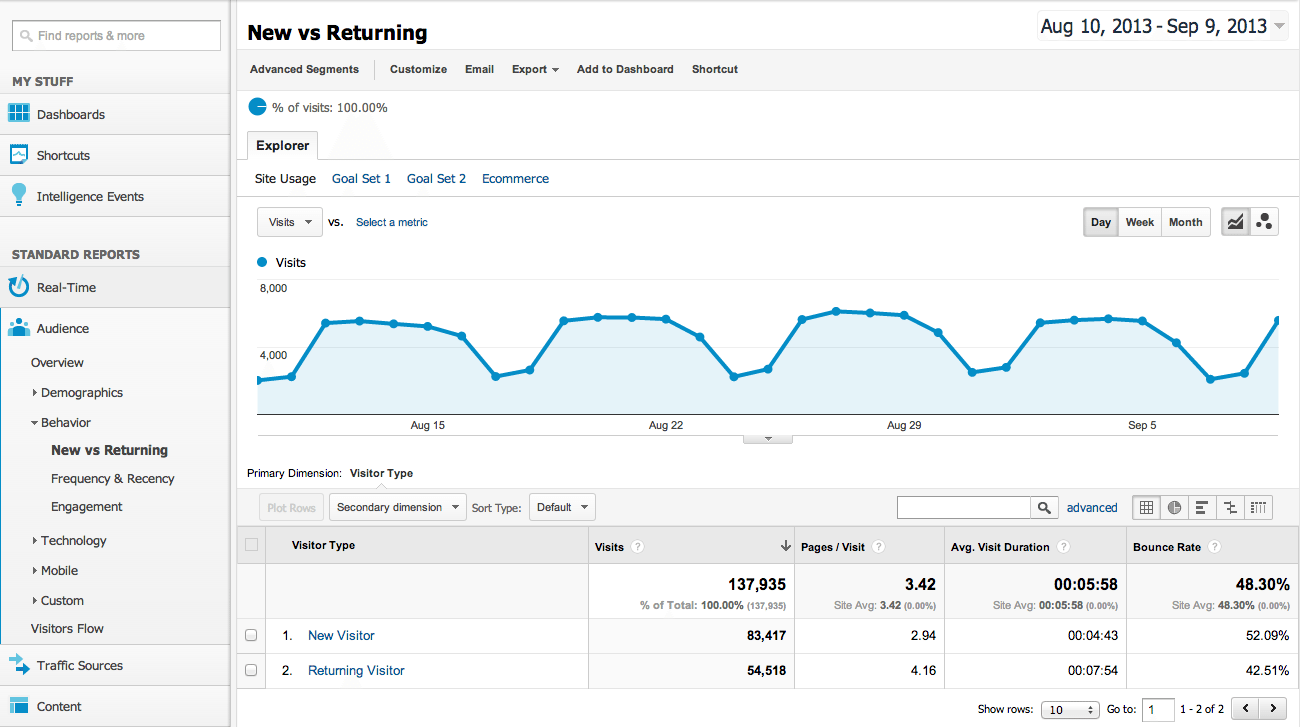
This is essentially another way of measuring engagement, which, by extension means the effectiveness of your site. Warning signs would be a high percentage of visitors who only visit your site once or a high percentage of visitors who visit regularly but never show any indication of making a purchase or even an enquiry.
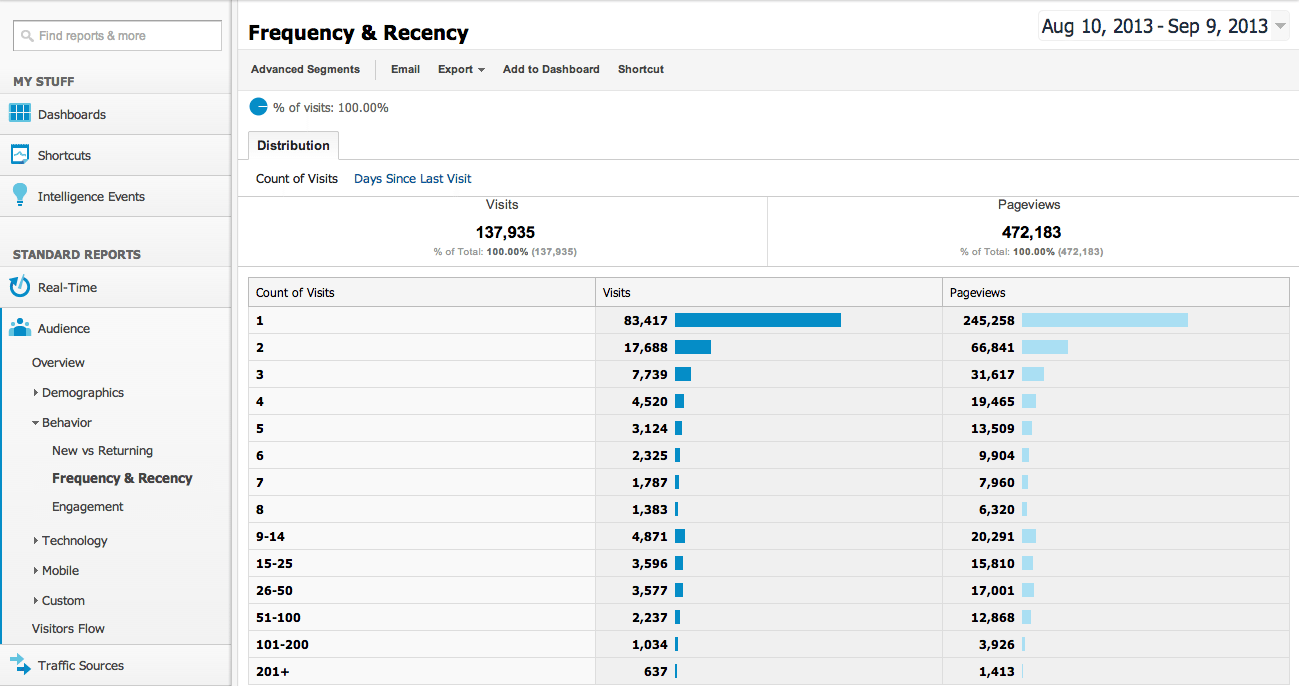
This simply tells you how often your site has been visited by a particular visitor during a particular time period. This data has to be treated with a certain degree of caution, since dropped connections on mobile devices can lead to people having to return, possibly more than once, to a site, because of network issues rather than because they necessarily would have done so had they had a better connection.
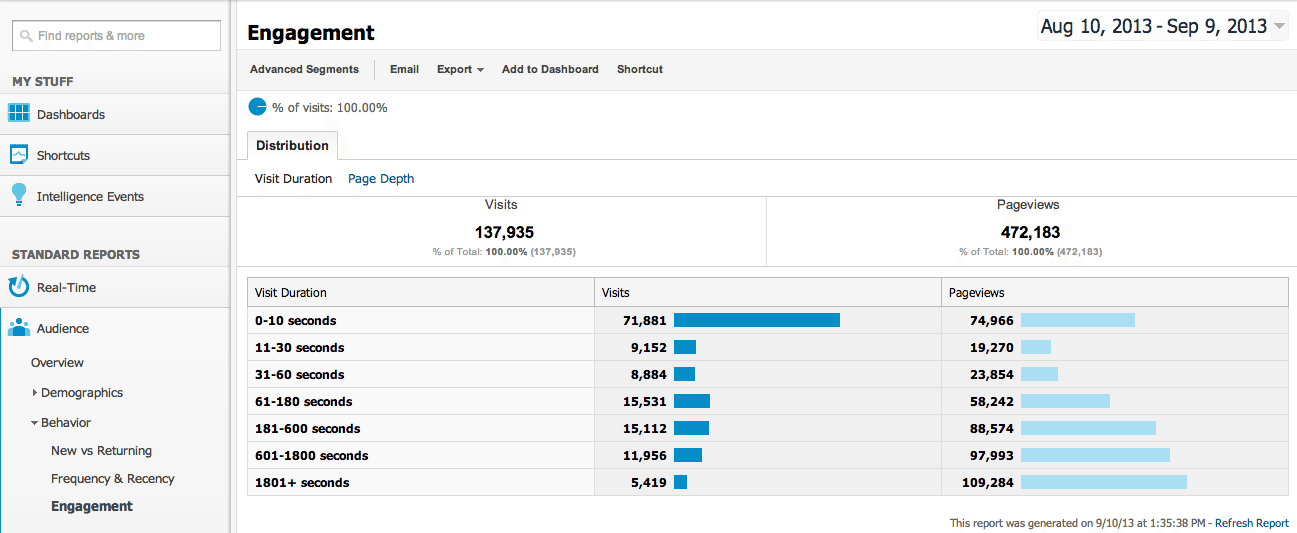
This is probably the single most important standard report produced by Google Analytics. How are visitors interacting with your site? This information has to be put into context. If you are running a technical support website, then you probably want visitors to be able to find what they want quickly and easily, similarly if you are running an e-commerce store, you want visitors to be able to make purchases quickly and easily. In either case, you are probably looking for visitors only to spend short amounts of time on these sections. On the other hand, if you are making a significant push in the area of content marketing, you want to see visitors spending time reading and exploring your content. Quickly skipping from one article to the next is a potential indicator of lack of engagement.
In an ideal world, all websites would work perfectly across all browsers at all resolutions. In the real world, many web designers will settle for functioning adequately across most browsers and resolutions and perfectly across the browsers and resolutions which are most popular with their users.
While this may seem defeatist, the reality is that at this time internet users are on multiple versions of IE and Safari, Chrome and Firefox both have a strong following and mobile-friendly browsers such as Opera and Dolphin have their own user base. While these browsers all work along fundamentally similar lines, they all have their own unique quirks and so unless designers are happy to use a bare-bones approach, it’s extremely challenging to create a website which functions perfectly across all possible browsers.
Similar comments apply to network providers. In an ideal world, it would make no difference, in the real world, knowing whether or not most of your customers are using genuine broadband or whether a significant percentage of them are restricted by capped speeds may make a difference to the content of your site.
Mobile is another criterion which should make no difference but may do. Seeing how mobile visitors access your site may suggest ways as to how to improve their experience, for example, by making key sections of your site more mobile-friendly.
Customer Reporting is the beating heart of Google Analytics. As its name suggests, it allows organizations to view reports on the data that interests them. Creating custom reports is simple enough for any member of staff to grasp, no matter how non-technical.
Google Analytics looks at customer reports in terms of dimensions and metrics. Dimensions are essentially descriptive terms which can be applied to visitors, which metrics are the way in which the dimensions are measured. For example if you wanted to measure sales made by visitors in different geographical locations, sales would be the metric and geographical location the dimension.
Users can create their own dimensions and metrics, as well as choosing from the wide selection already installed in Google Analytics. At the same time, Google Analytics will block combinations which cannot logically be matched together.
Setting up custom dimensions and metrics does require some degree of familiarity with Google Analytics, not to mention an understanding of statistics and statistical measurement; however, once they are set up, it is relatively straightforward for most staff to access and use them.
Standard accounts support up to 20 custom dimensions and 20 custom metrics. Premium accounts have up to 200 custom accounts and 200 custom metrics. It should be noted that at this current time it is not possible to delete custom dimensions, but they can be disabled to make way for new ones. If they are disabled, whether by accident or design, then it is best to leave them that way. In other words, if the need arises to invoke the dimension again, it is better to rebuild it from scratch than to try to reactivate the disabled dimension.
Another data source is what Google Analytics calls Custom Variables. These are essentially ways of segmenting your visitors further. Often, this is implemented using information given in web-forms to divide visitors by such variables as age and gender.
All of these reports are managed from a simple and effective dashboard, making it easy for users to access the data they need when they need it.
Further Reading: Analytics and the Reporting Lifecycle